Properties of Graphs of Quadratic Functions
1. The graph of a quadratic function f(x)=ax^2+bx+c is called a parabola.
2. If a > 0, the parabola opens upward; if a < 0, the parabola opens downward.
3. As | a| increases, the parabola becomes narrower; as | a| decreases, the parabola becomes wider.
4. The lowest point of a parabola (when a > 0) or the highest point (when a < 0) is called the vertex.
5. The domain of a quadratic function is (-∞,+∞) because the graph extends indefinitely to the right and to the left. If (h, k) is the vertex of the parabola, then the range of the function is [k;+∞) when a > 0 and (-∞; k] when a < 0.
6. The graph of a quadratic function is symmetric with respect to a vertical line containing the vertex. This line is called the axis of symmetry. If (h, k) is the vertex of a parabola, then the equation of the axis of symmetry is x=h.
Vertex and Intercepts
1. To determine the vertex of the graph of a quadratic function, f(x)=ax^2+bx+c , we can either:
a) use the method of completing the square to rewrite the function in the form
f(x) = a(x – h) + k. The vertex is (h, k). , or
b) use the formula x =-b/2a to find the x-coordinate of the vertex; the
y- coordinate of the vertex can be determined by evaluating .
2. If a > 0, then the y-coordinate of the vertex represents the minimum value of the function; if a < 0, then the y-coordinate of the vertex represents the maximum value of the function.
3. To find the y-intercept of the graph of f(x) = ax^2+bx+c, find f(0);
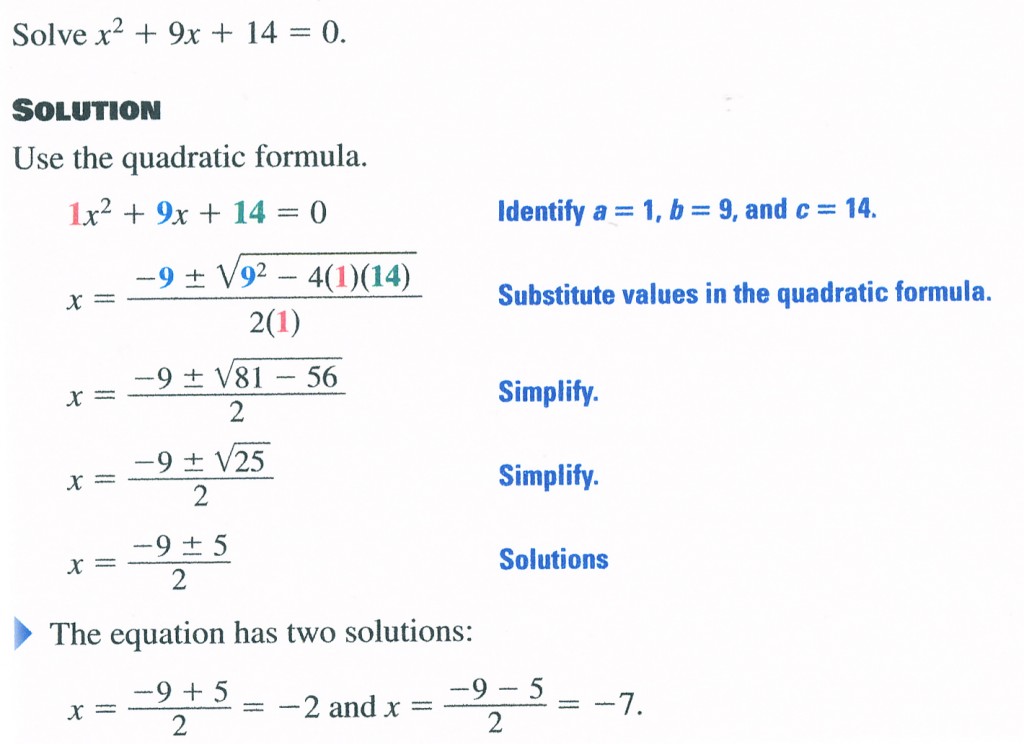
to find the x-intercepts, solve the quadratic equation ax^2+bx+c = 0.
Example 2
Solution
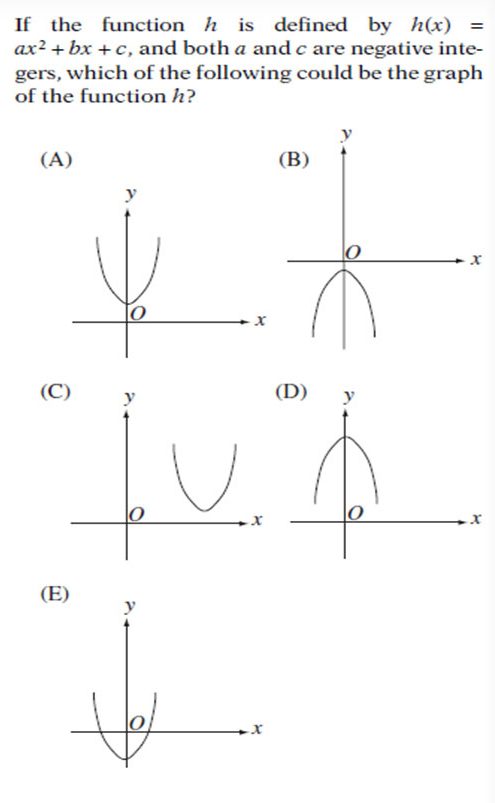
As soon as we knew that a <0 it is mean that the parabola opens downward so it can be d) or b) case. Y –intercept is c and it is negative, so it can be only case b).


